Decision Tree
Decision Tree
Another way to present the consequences together with probabilities and outcomes is decision tree. A decision tree can be a more efficient representation of the present uncertainties, alternatives and consequences than a consequence table.
When drawing a decision tree, using quantitative measures, the hardest part is how to assign chance (probability) because it involves a high degree of subjective probability estimation where it is easily affected by heuristics and biases.

Example 3
Using Example 3 in the previous article <Uncertainty and Chance>, with only one uncertainty labelled as "1", it is even much clearer to visualise the uncertainty and consequence of the decision. Descriptive consequences are seen in Figure 1, whilst quantitative measures in Figure 2.

Figure 1. Decision tree of only one uncertainty in Example 3 using qualitative consequences.

Figure 2. Decision tree of only one uncertainty in Example 3 using quantitative consequences.
Difference between Decision Tree and Consequence Table
There are a couple of difference, the first one is chance of occurrence, second is linkage of subsequent decisions with the possible consequences.
- A consequence table doesn't allow you to consider/ jot down the chance of happening. You just compare the consequences of all objectives (criteria) you listed out. It allows you to cancel out some objectives in the table using Even Swap method, but it doesn't account for chance.
- As for a consequence table, it can only illustrate the consequences for one decision problem. For decision tree, it can connect the outcomes and consequences from one decision with that from other decisions.
- While there are more than one uncertainty, the uncertainties are
connected and that will branch out different consequences at varying
probabilities, so a decision tree is particularly useful when it comes
to a decision where it got different decision points mingling with
different uncertainties.
==========================
Example 4: Decision Tree for One Decision Problem
A man, Mr K, has a business conflict with his business partner. Mr K is thinking about to sue his partner for money compensation for his loss. Below is the information:
If takes legal action:
- The cost of undertaking the lawsuit: $450,000
- The possible outcome and [chance] of the lawsuit are: Win [75%]; Lose [25%]
- If win, the compensation being awarded is estimated from $500,000 to $1,500,000 according to the similar cases in the past and the past record of this judge ordered.
- If lose, no compensation received and lose the legal fee of $450,000
If not take legal action:
- No need to pay the cost of $450,000
- Mr K's business partner agrees to recompense him $600,000 if Mr K gives up suing him.
Based on the above information, we can draw a decision tree below (Figure 3):

Figure 3. Decision tree based on the preliminary information.
Further Analysis
To analyse the situation more clearly, we will do the following:
1) Firstly we should break the possible outcome of the money awards into components (range):
- Small award: $500,000 - $750,000
- Medium award: $750,001 - $1,000,000
- Large award: $1,000,001 - $1,250,000
- Very large award: $1,250,001 - $1,500,000
2) Assign chance to each of the components. Since we have no knowledge about the probability of the individual award range, so we put an equal probability for all at 25% chance. Refer to <Subjective Probability Estimation> and <Principle of Insufficient Reason>.
For better comparison, I employ the median of the range to represent the award of 'Small', 'Medium', 'Large' and 'Very large'. Table 1 depicts the possible outcomes with the divided money range.

Table 1. Illustration of the divided money award with chance in case of winning the case.
3) Account all other costs for the total consequence in money equivalent value, such as time sacrifice and emotional energy put in for the lawsuit. We convert these intangible cost to a tangible value, which is money. The conversion is done by trade-off, i.e. how much would Mr K be willing to pay (WTP) to rid himself from the lengthy court litigation. This is the money worth for the indeterminable variables like time, psyche, emotional energy, anxiety, family annoyance, etc.
Although in fact the conversion of emotional energy sacrifice to money term should be different in different winning situation, and in different money award outcomes, for simplicity I just assume such a conversion at different situations/ money ranges are all the same.
Total consequence (in money equiv.) = Median money award - WTP for time sacrifice - WTP for emotional energy - cost
For small award:
Total consequence (in money equiv.) = $625k - $20k - $25k - $450k = $130k
Table 2 summarises the individual sum of money and calculate the total consequence in terms of money.

Table 2. Calculation of total consequence in terms of money value for undertaking the lawsuit.
4) In order to draw a simplified decision tree with all uncertainties in terms of money equivalent consequences, we also should calculate the money loss in case of losing the case (see Table 3).

Table 3. Illustration of money loss in case of losing the case.
Now, with the information of Tables 1 to 3, a clearer decision tree can be drawn as in Figure 4.
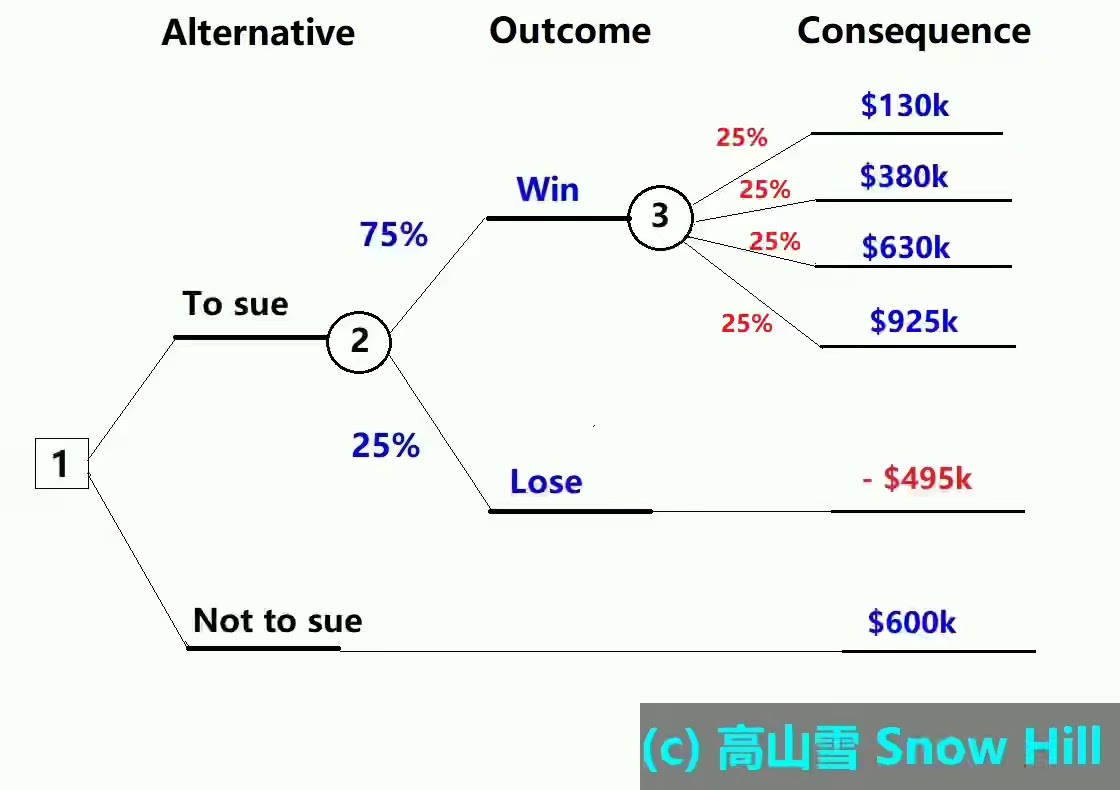
From the decision tree in Figure 4, the situation is much clearer now.
- If
Mr K takes legal action, he has 25% chance that he will lose the case
and end up losing $450k legal fee. This is the worst consequence of all, even the chance is relatively small, it is still possible.
- At the same time, he has 75% of
winning the case rewarding from $500k - $1.5m (nominal amount awarded).
- Once lawsuit is
started, he expects that there will be a lengthy legal process which
means he needs to put in money, time and emotional energy into it. This means at the
minimum he has 75% chance of having $130k net gain (minus all costs) and
maximum of $925k net gain (see Table 2). These are assumed to be the same for winning or losing situation (in fact, the emotional energy input to losing situation should be higher).
- If
he chooses not to take legal action, he will have 100% chance of
getting the compensation of $600k (net gain) from his business partner
without any loss.
Expected Value Theory
Another objective reference we can take is by comparing the total expected value of taking legal action vs that of not taking legal action.
Table 4 summarises all individual Expected Values for each money rewards / loss including winning or losing. The total Exptected Value of taking legal action is the summation of all individual Expected Values.
- Total Expected Value of taking legal action = 75% × 25% × $130k + 75% × 25% × $380k + 75% × 25% × $630k + 75% × 25% × $925k- 25% × $495k = $263,437
- Total Expected Value of not taking legal action = 100% × $600k = $600k
So by comparison, it is clear that, a rational choice is that Mr K should choose not to take legal action, because:
Expected Value of taking legal action ($263k) < Expected Value of not taking legal action ($600k)
Even though objectively Mr K should take the option of not taking legal action, there is something we should consider, which is risk tolerance.

Table 4. Total Expected Value of taking legal action.
Conclusion
A decision tree can only help us visualise all uncertainties and their outcomes more clearly, or even it can connect all decision problems for you. But it cannot decide for you. It is still down to you to make the decision and bear all the responsibilities for any unpleasant consequences come upon your own head in future. This is why, it is of tremendous importance for every person to learn how to make decision.
Expected Value theory is deployed here to help make a rational choice, but there are something we have missed so far, which is personal risk tolerance level. This involves some sort of emotional element for decision making. I will have another article posted for it <Assessing Risk Tolerance for Decision Making>.
More Topics:
Smart Choices (1) | Focus and Defining Problem
Smart Choices (2) | Eight Elements in PrOACT Approach
Smart Choices (3) | Comparing with Consequence Table
Uncertainty and Assigning Chance
Subjective Probability Estimation
Principle of Insufficient Reason
Assessing Risk Tolerance for Decision Making
Reference
John S. Hammond, Ralph L. Keeney, Howard Raiffa, Smart Choices - A Practical Guide to Making Better Life Decisions, Broadway Books, 1999.
==================================
Disclaimer
No part of the post may be reproduced or transmitted in any form or by any means, electronic or mechanical, including photocopying, recording, or by any information storage and retrieval system, without written permission from the blog creator, Snow Hill 高山雪.This is a personal blog, the blog creator does not warrant, guarantee, or assume responsibility for the accuracy or reliability of any information posted. Under no circumstances shall the blog creator has any liability to you for any loss or damage of any kind incurred as a result of the use of, or reliance on, the information of the site or blog posts. The use of the site and your reliance on any information on the site is solely at your own risk.
© Copyright 2020-2022 高山雪 Snow Hill. All rights reserved.


留言
發佈留言